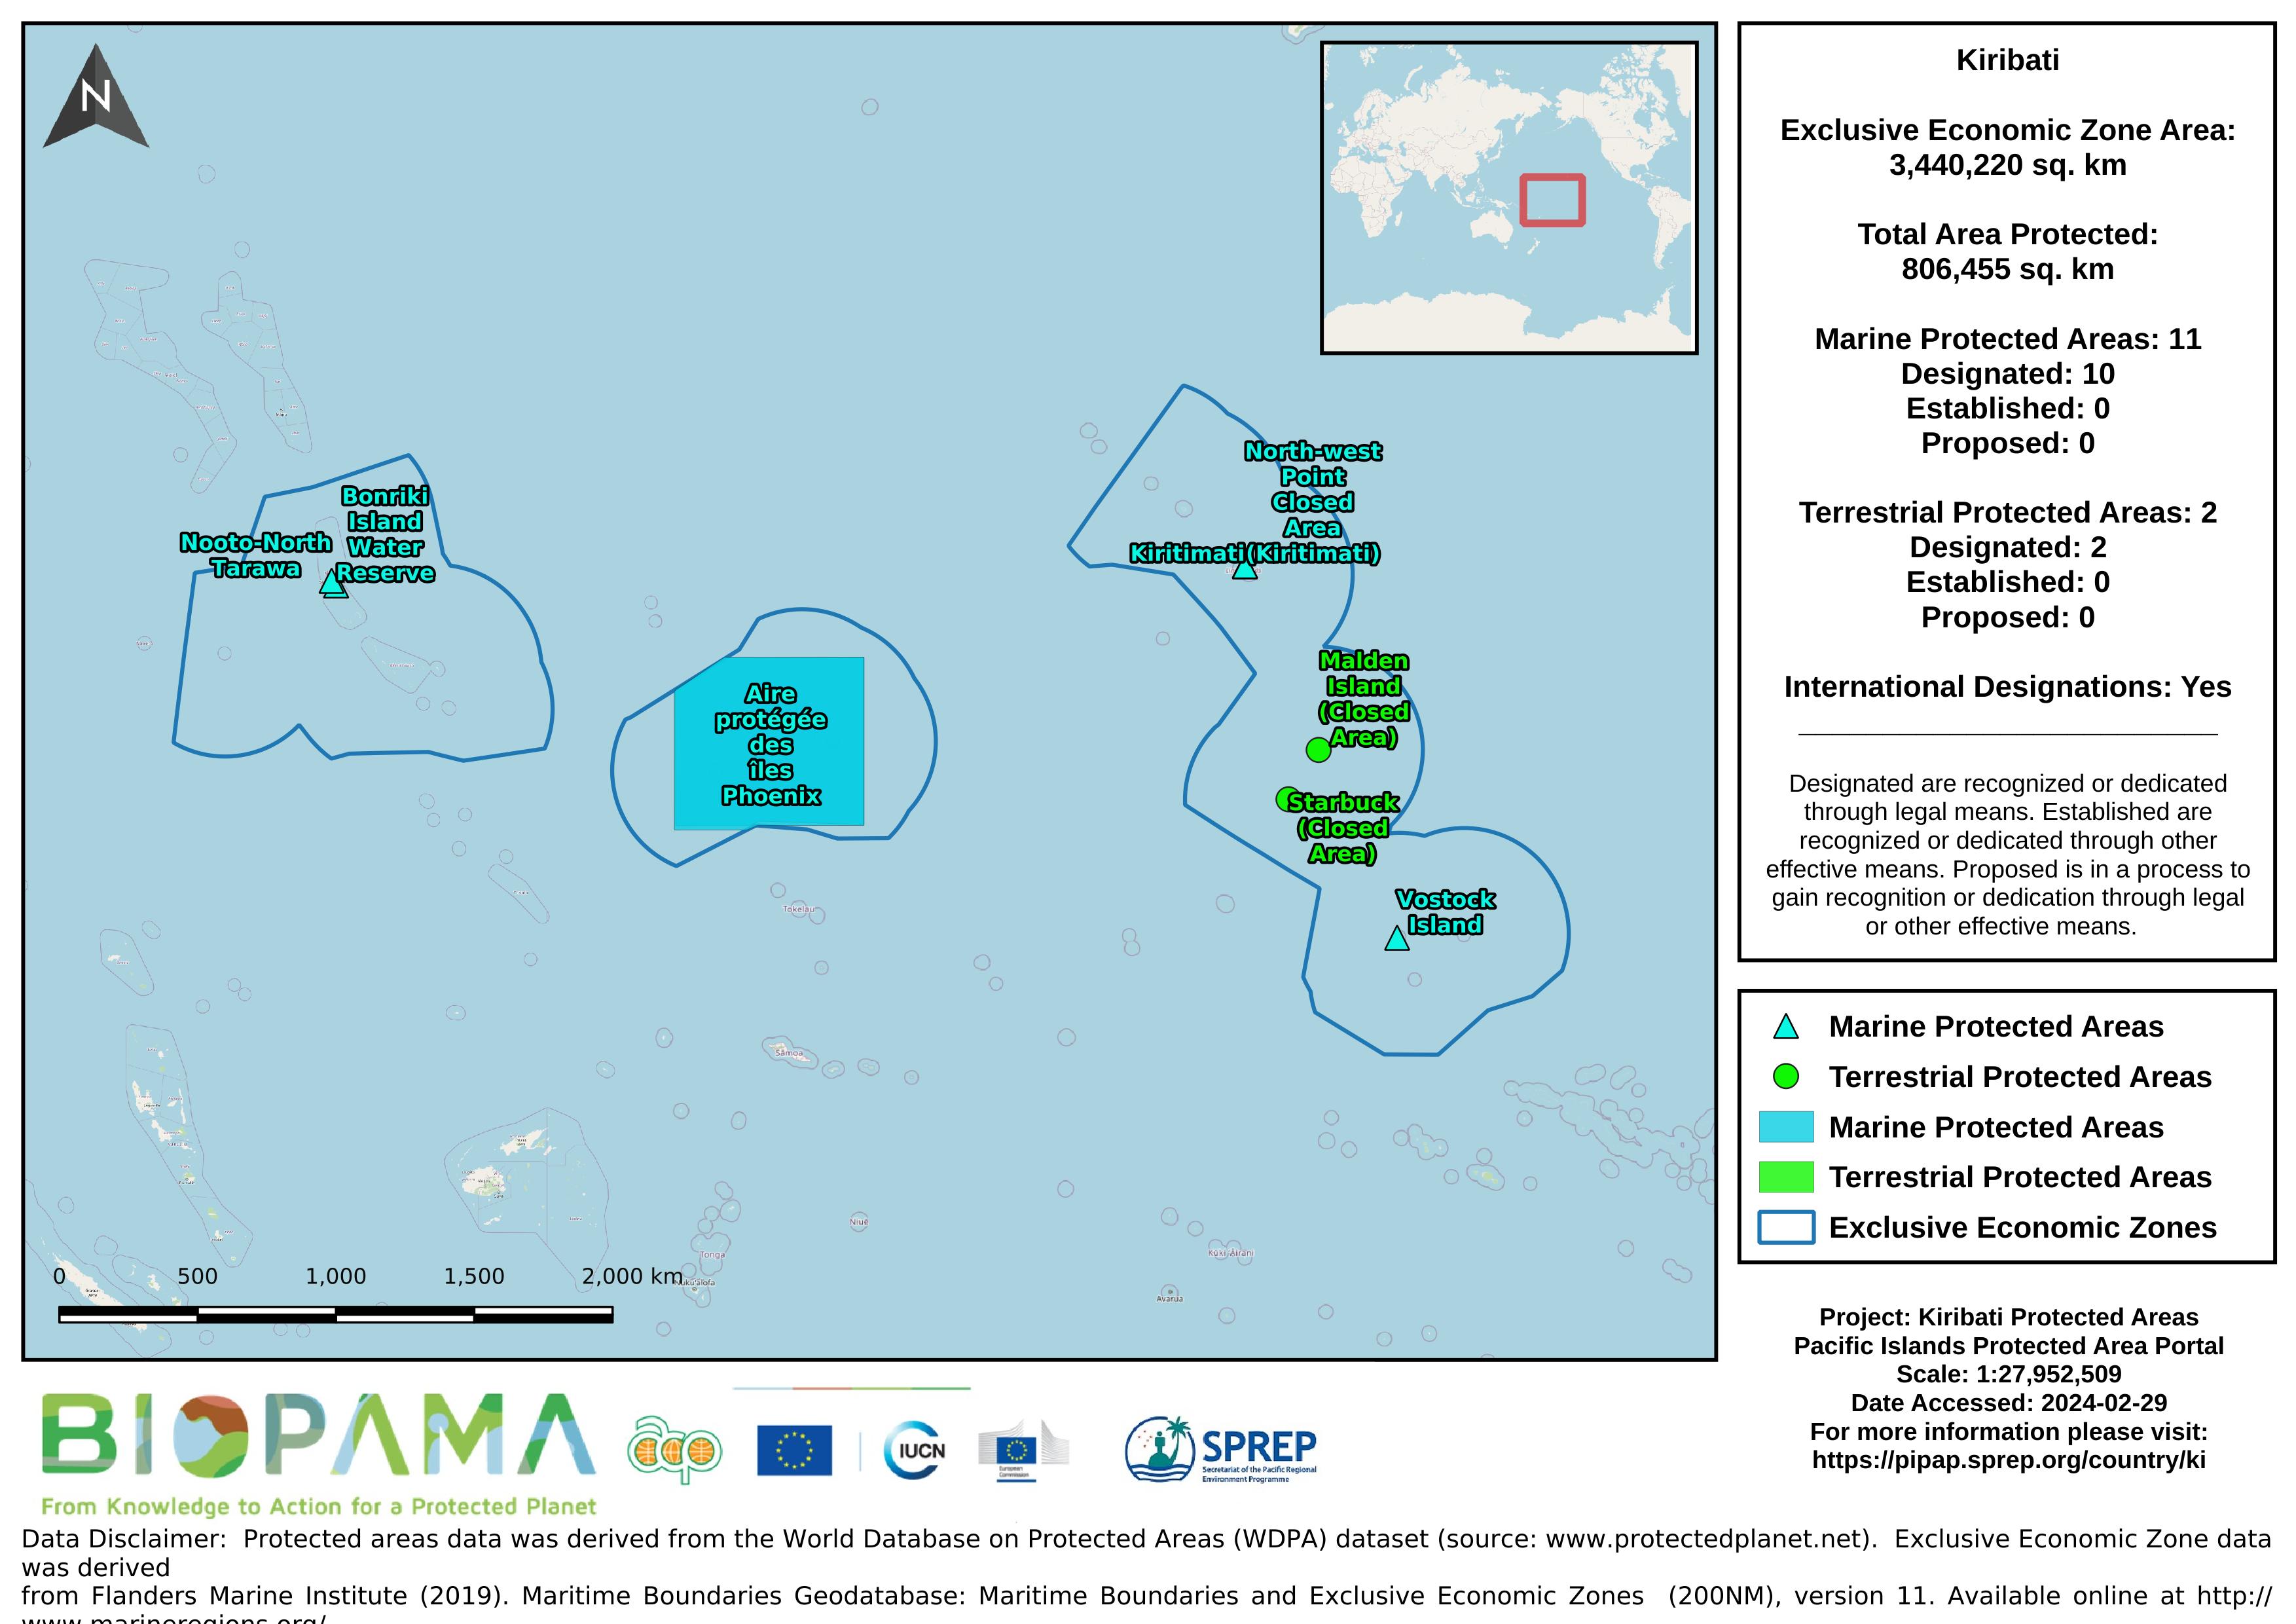
Map of the protected areas for Kiribati with country-level summary statistics on the amount of area under protection, count for each type of protected area (terrestrial or marine), and the count of their designation.
Map of the protected areas for the Line Islands, Kiribati with country-level summary statistics on the amount of area under protection, count for each type of protected area (terrestrial or marine), and the count of their designation.
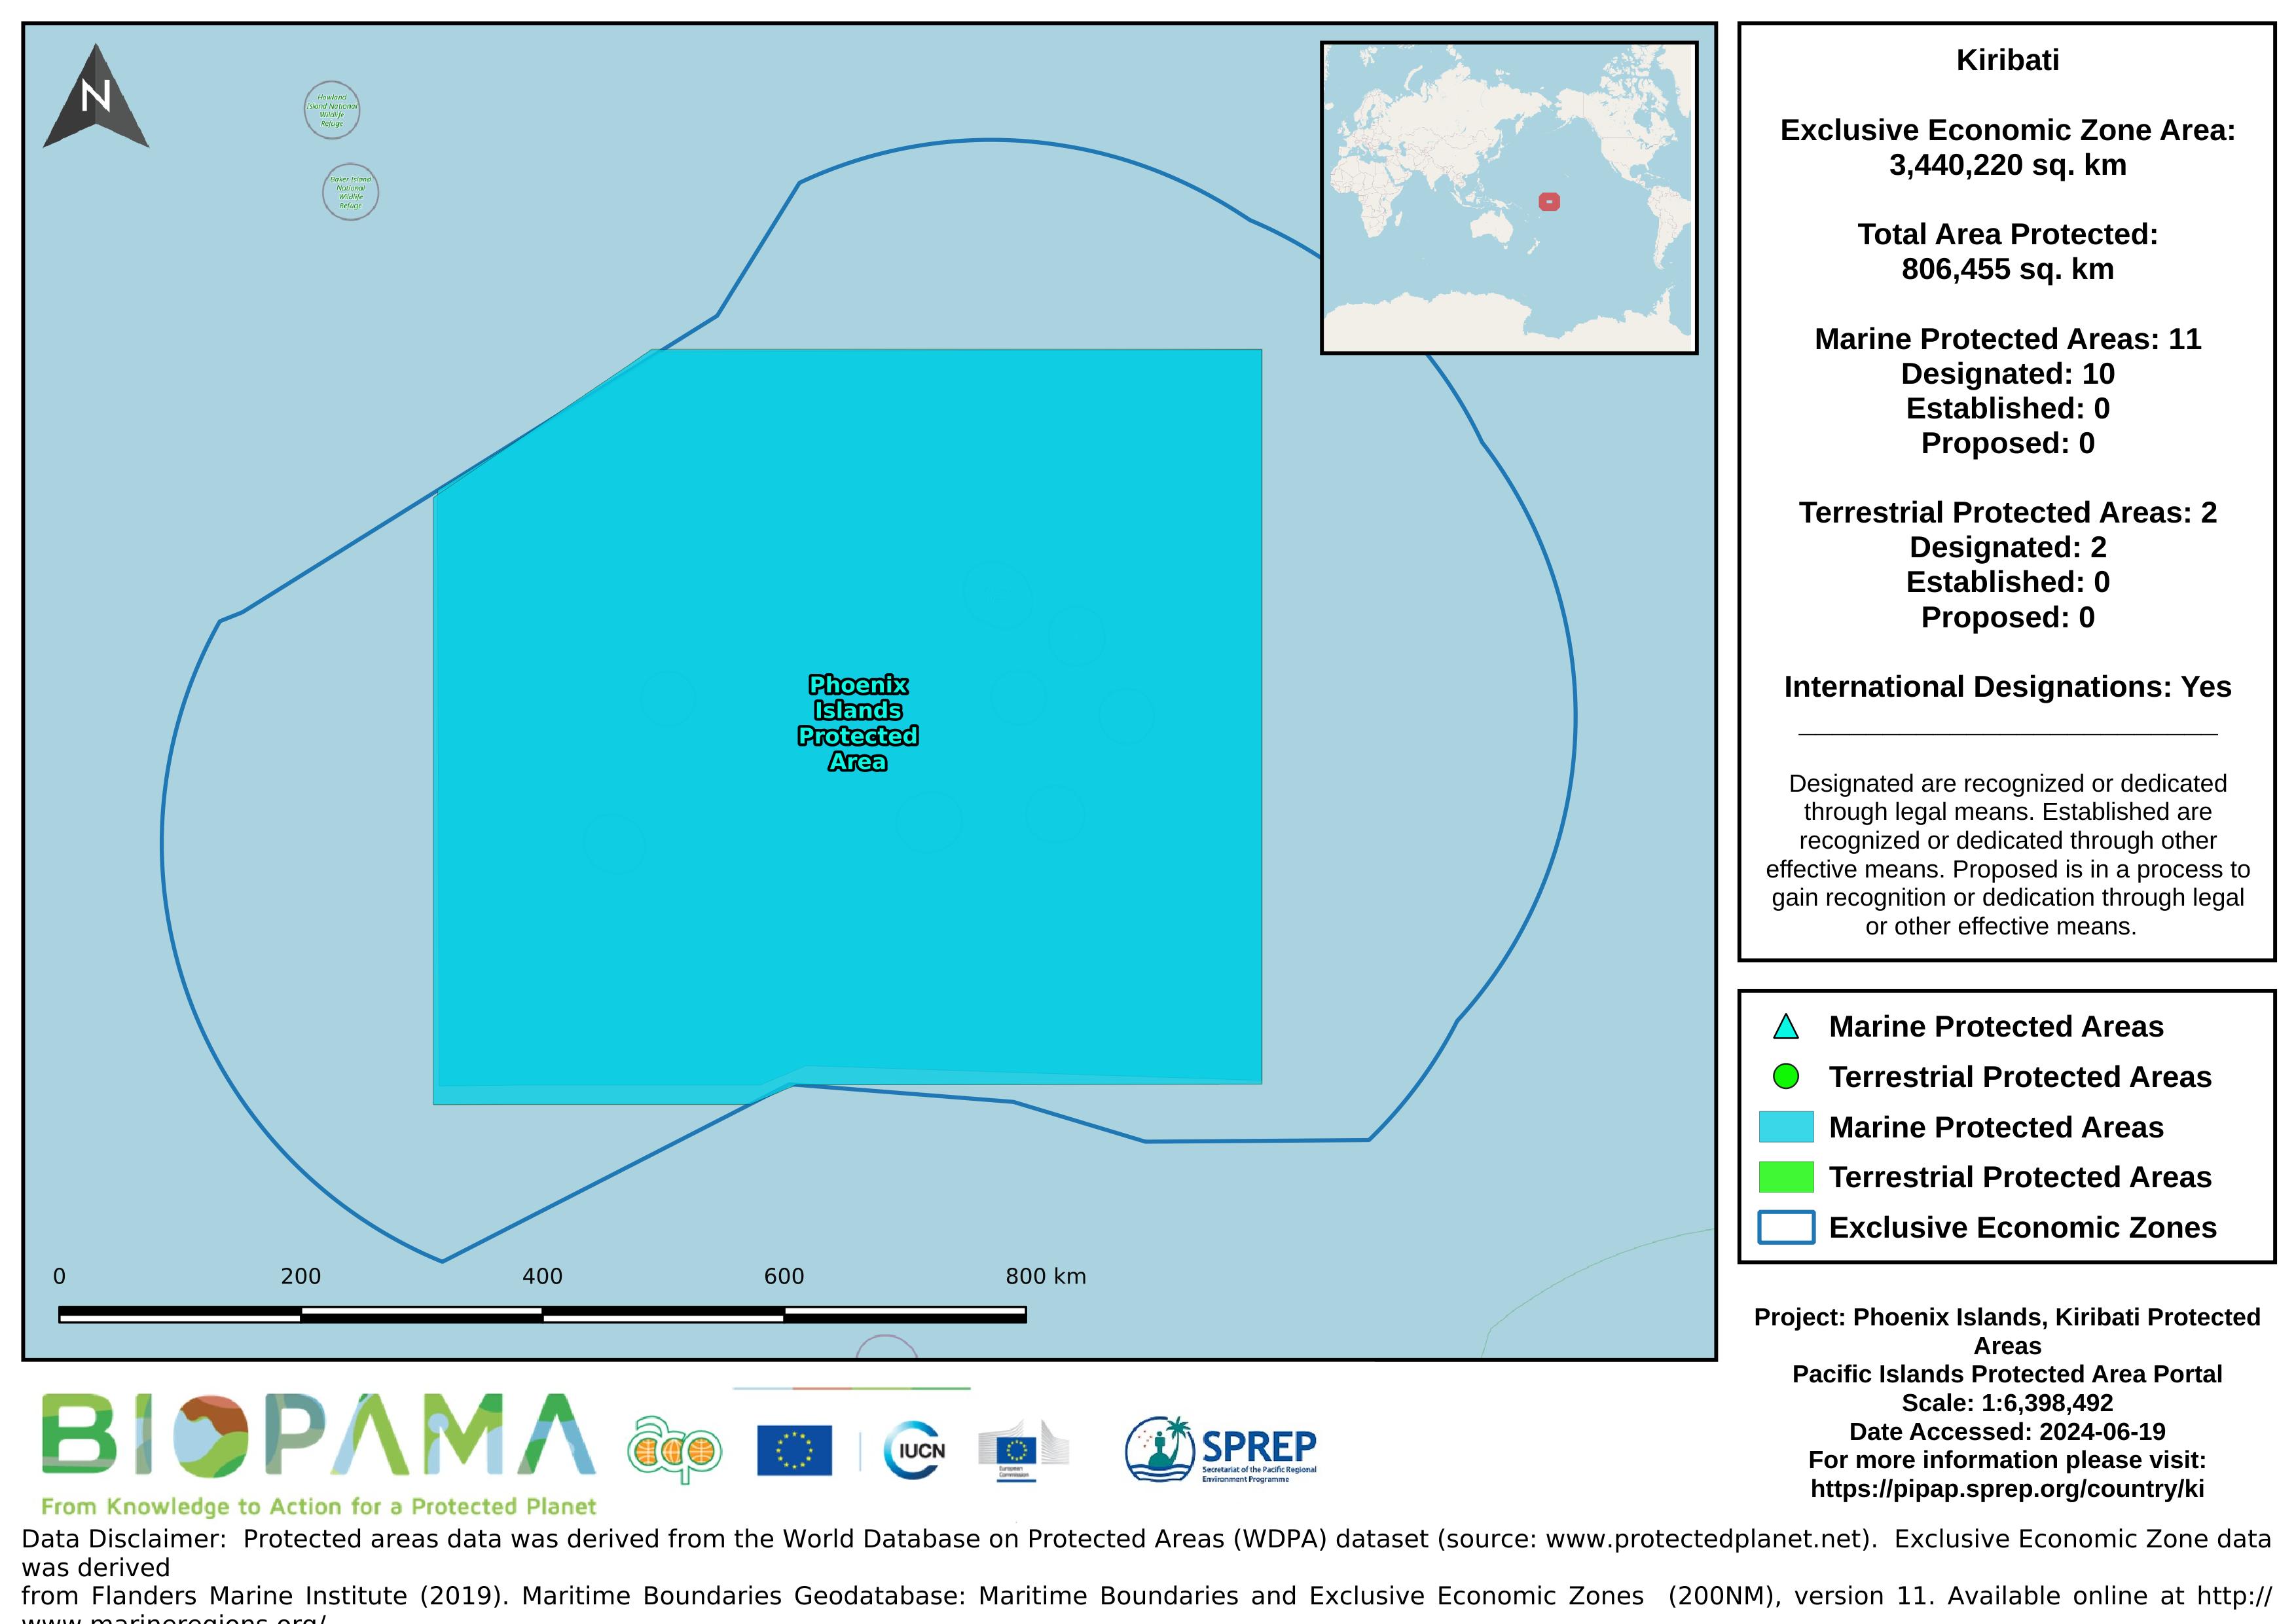
Map of the protected areas for the Phoenix Islands, Kiribati with country-level summary statistics on the amount of area under protection, count for each type of protected area (terrestrial or marine), and the count of their designation.
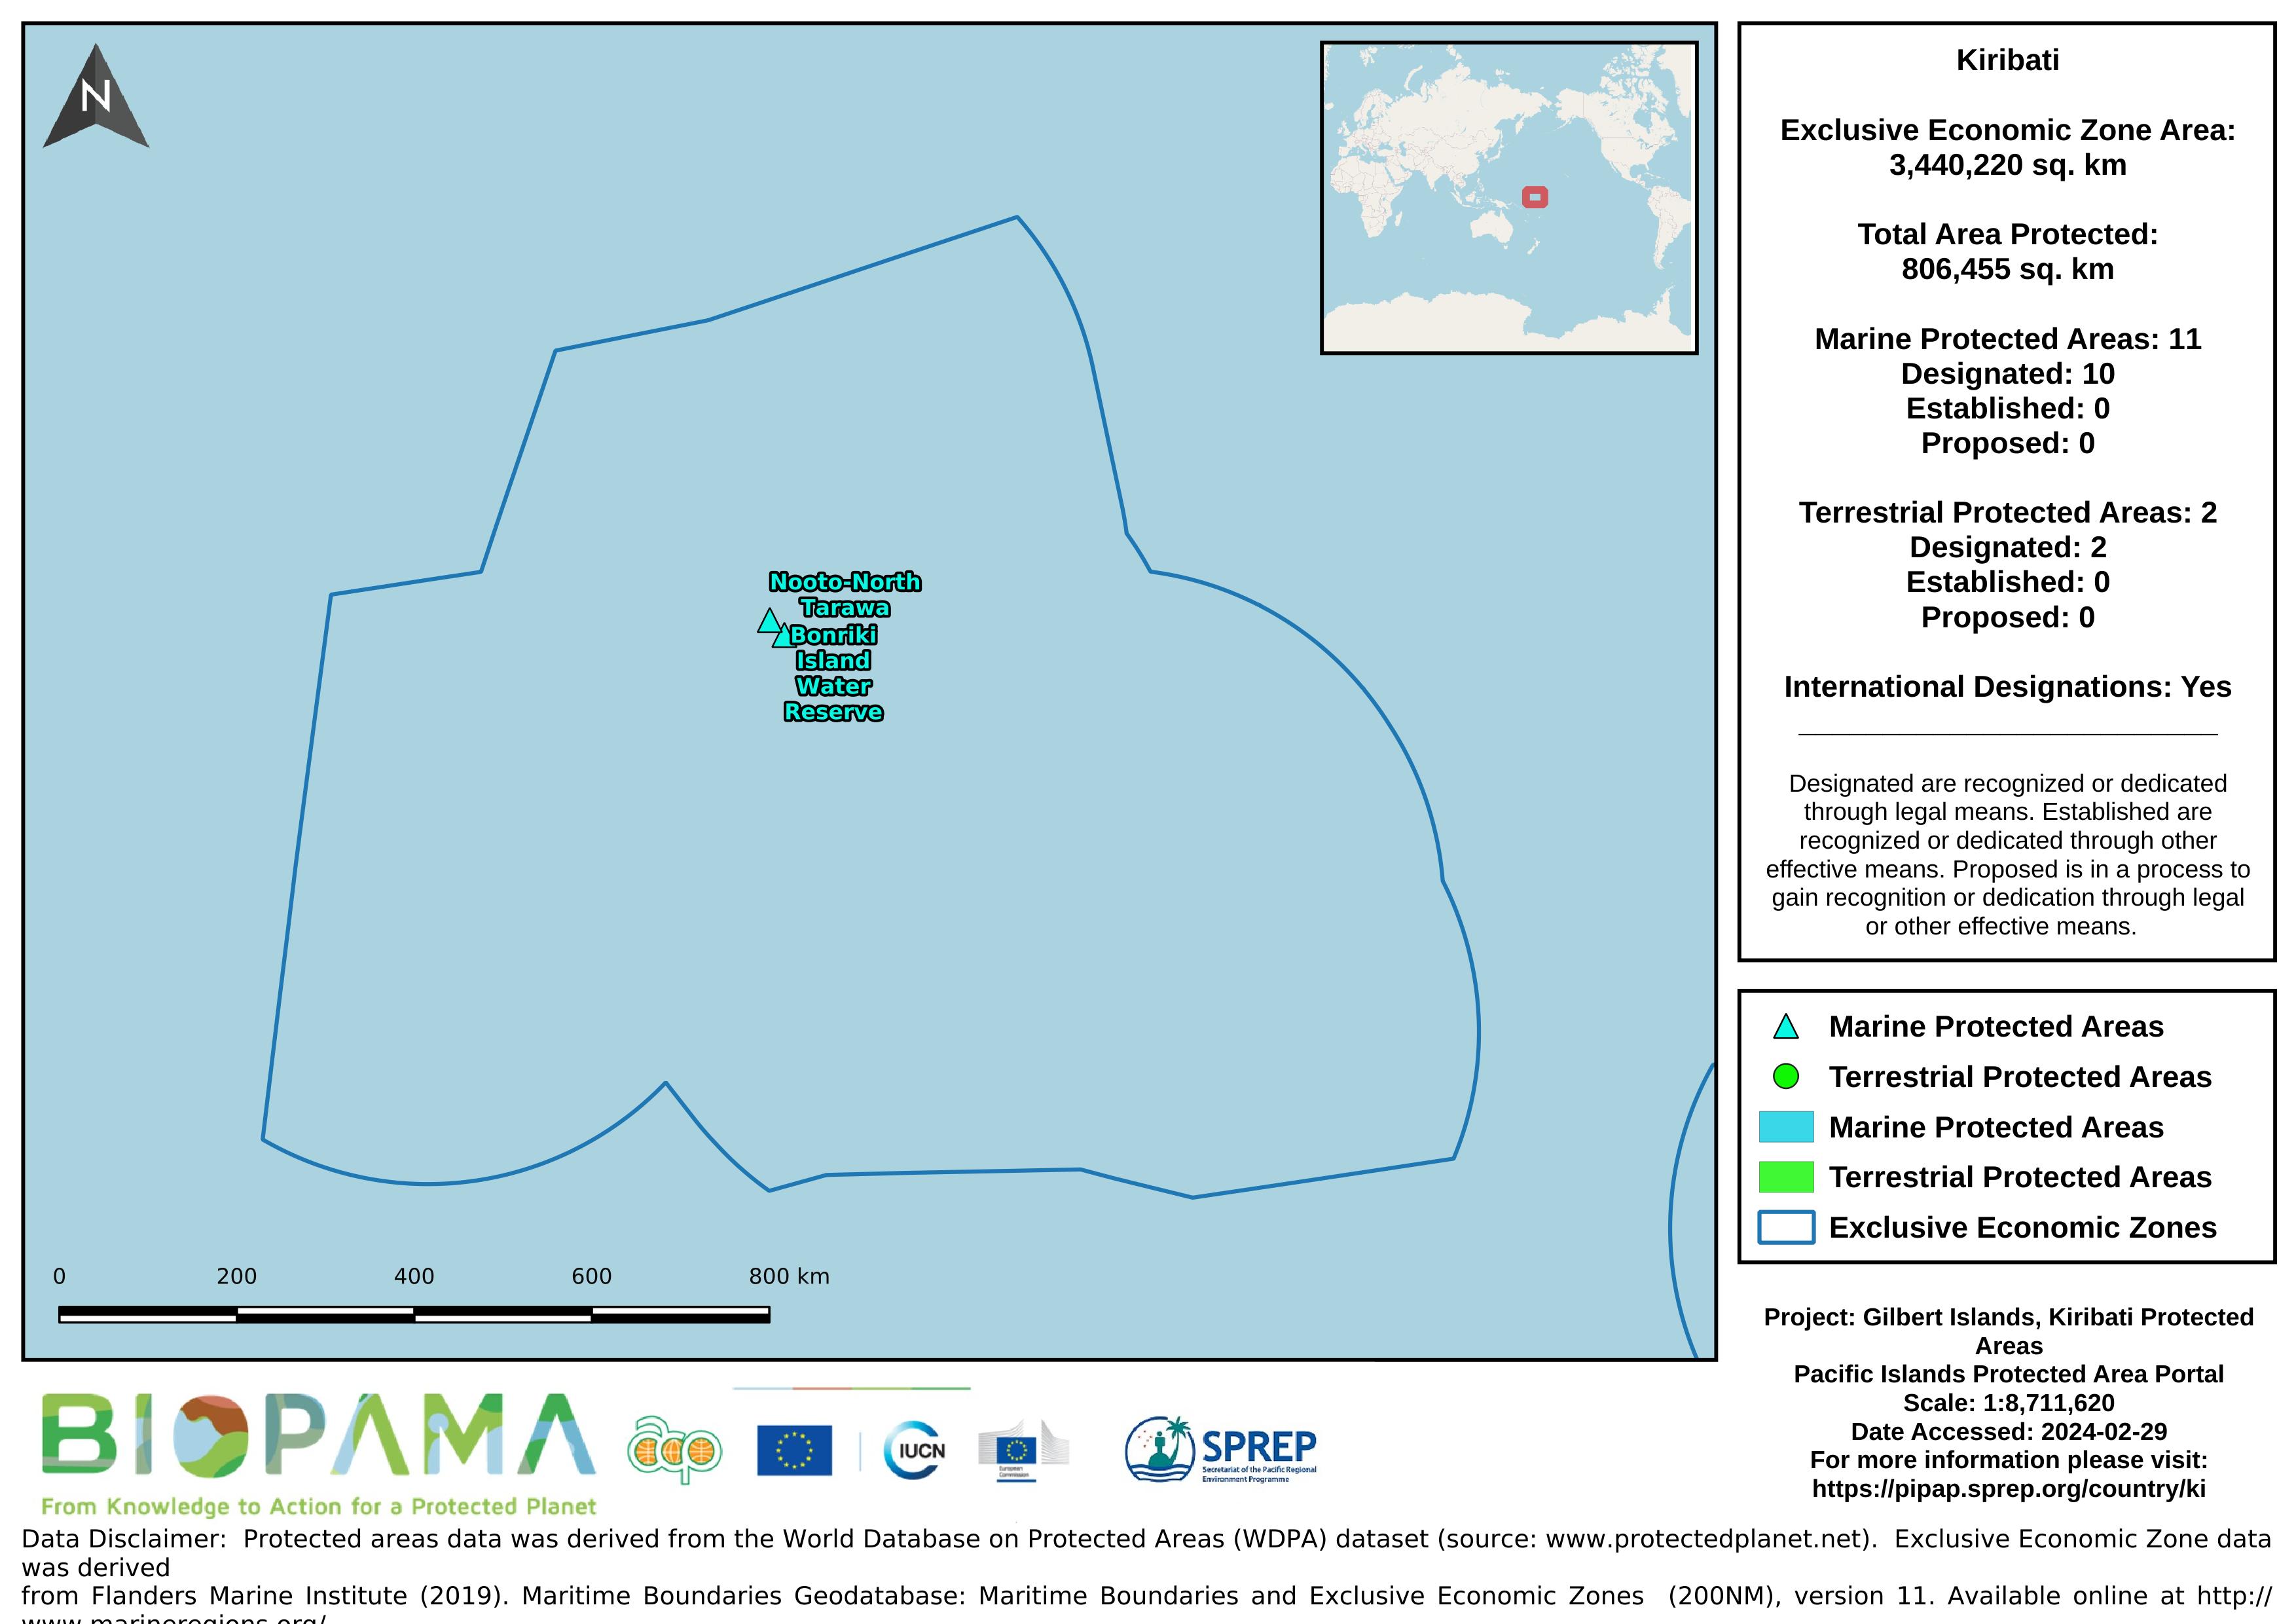
Map of the protected areas for the Gilbert Islands, Kiribati with country-level summary statistics on the amount of area under protection, count for each type of protected area (terrestrial or marine), and the count of their designation.
A direct internet link to access statistics and related info submitted to the UNEP Ozone Secretariat
A direct internet link to access statistics and related info submitted to the UNEP Ozone Secretariat
A .cvs format of the data in the excel sheet for easier and immediate reading and interpretation.
Pacific islands region exclusive economic zones (EEZs)
Each value represents the number of dumping events observed on fishing vessels during the period 2003-2015
gis file with points on pollution incidents in the Solomon Islands
CVS version of the data in excel
direct link to Kiribati's data on the GBIF records
Raster data representing the mean levels of calcite in µmol/m3 for the surface water layer. The data are available for global-scale applications at a spatial resolution of 5 arcmin (approximately 9.2 km at the equator).
Marine data layers for present conditions were produced with climate data describing monthly averages for the period 2000–2014, obtained from pre-processed global ocean re-analyses combining satellite and in situ observations at regular two- and three-dimensional spatial grids.
Raster data representing the mean levels of current velocities in meters/second for the surface water layer. The data are available for global-scale applications at a spatial resolution of 5 arcmin (approximately 9.2 km at the equator).
Marine data layers for present conditions were produced with climate data describing monthly averages for the period 2000–2014, obtained from pre-processed global ocean re-analyses combining satellite and in situ observations at regular two- and three-dimensional spatial grids.
Raster data representing the mean levels of iron in µmol/m3 for the surface water layer. The data are available for global-scale applications at a spatial resolution of 5 arcmin (approximately 9.2 km at the equator).
Marine data layers for present conditions were produced with climate data describing monthly averages for the period 2000–2014, obtained from pre-processed global ocean re-analyses combining satellite and in situ observations at regular two- and three-dimensional spatial grids.
Raster data representing the mean levels of pH for the surface water layer. The data are available for global-scale applications at a spatial resolution of 5 arcmin (approximately 9.2 km at the equator).
Marine data layers for present conditions were produced with climate data describing monthly averages for the period 2000–2014, obtained from pre-processed global ocean re-analyses combining satellite and in situ observations at regular two- and three-dimensional spatial grids.
Raster data representing the mean levels of photosynthetically active radiation (PAR) in E/m2/year for the surface water layer. The data are available for global-scale applications at a spatial resolution of 5 arcmin (approximately 9.2 km at the equator).
Marine data layers for present conditions were produced with climate data describing monthly averages for the period 2000–2014, obtained from pre-processed global ocean re-analyses combining satellite and in situ observations at regular two- and three-dimensional spatial grids.
CSV file containing the global distribution of hydrothermal vent fields in WGS84 coordinate system.
GeoJSON file for earthquake centers over a magnitude of 4.5 for the Pacific Islands Region for years 2000-2004. Data are derived from the ANSS Comprehensive Earthquake Catalog (ComCat). ComCat contains earthquake source parameters (e.g. hypocenters, magnitudes, phase picks and amplitudes) and other products (e.g. moment tensor solutions, macroseismic information, tectonic summaries, maps) produced by contributing seismic networks.